Your solar system has an app Now - and it knows more than you think
Tue, 5th May 2026 (Today)
There's a good chance you checked your solar app this morning. Maybe you glanced at how much the system generated yesterday, or confirmed the battery was full before you left for work. If that's the extent of your relationship with your solar monitoring platform, you're using roughly 10% of what it can do.
The monitoring software shipped with modern solar and battery systems has become one of the more sophisticated consumer technology platforms in the home - quietly tracking, predicting, and optimising your household energy use in ways that most owners haven't explored and manufacturers haven't done a great job of explaining. Behind the generation graph on your home screen sits a data engine that knows your consumption patterns, anticipates tomorrow's solar yield from weather forecasts, adjusts your battery's charge and discharge schedule accordingly, and flags performance anomalies before they become faults.
In South Australia, where the grid environment is among the most dynamic in the world, this software layer has become genuinely important. The state's high solar penetration means grid conditions shift rapidly - export limits change, feed-in tariff windows open and close, and virtual power plant signals fire at moments the hardware needs to respond to in real time. For households researching the best solar battery deals Adelaide installers are currently offering, what's running inside the inverter and on your phone matters as much as the hardware specifications on the box.
So what are these platforms actually doing - and how smart have they really become?
What the App Is Actually Tracking
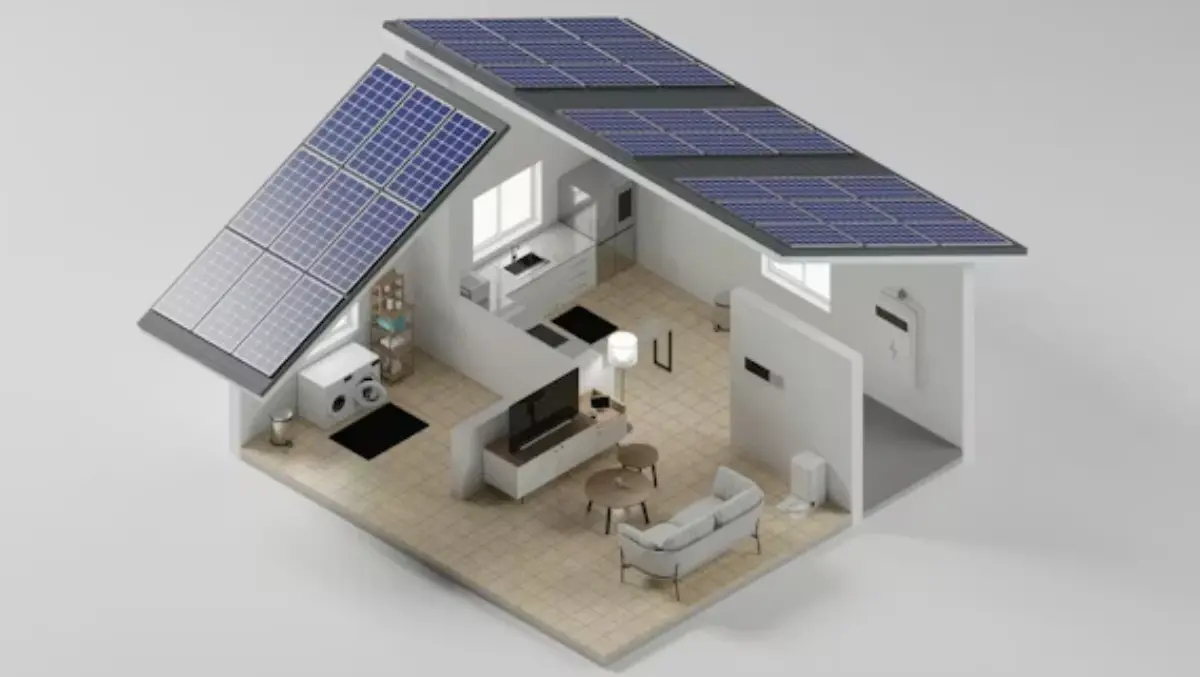
Open most modern solar monitoring apps - SolarEdge, SMA Sunny Portal, Sungrow iSolarCloud, Fronius Solar.web - and the home screen shows the same basic set of metrics: current generation, current consumption, grid import and export, battery state of charge. It looks simple. Underneath it, the data architecture is considerably richer.
Every modern hybrid inverter is logging performance data at the string or module level, typically at one-minute or five-minute intervals. That means the system is generating thousands of data points per day - panel-level generation, DC and AC voltage readings, inverter temperature, battery charge and discharge rates, grid frequency measurements, and reactive power figures that matter for grid compliance but are invisible in the standard consumer view.
This data is being transmitted to cloud platforms via your home Wi-Fi, where it's stored, processed, and analysed against both historical performance baselines and the specifications the manufacturer programmed for your specific system configuration. When a panel starts underperforming relative to its string neighbours, the platform sees it. When the inverter is running hotter than expected for the ambient temperature, the platform flags it. When battery cycle counts approach service thresholds, the platform notes it.
The gap between what the system knows and what the app surface shows the average user is significant - and it's partly a UX decision. Manufacturers have made a reasonable call that most homeowners don't want to interpret string-level IV curves over breakfast. But the data is there, accessible to accredited service technicians and, increasingly, to technically curious owners willing to dig into the advanced settings.
AI-Driven Scheduling: Where It Gets Genuinely Interesting
The most consequential development in solar monitoring software over the past two to three years isn't the data collection - it's what the platforms are doing with it.
AI-driven energy scheduling has moved from a premium feature to a standard inclusion on most mid-to-high-end hybrid inverter systems. The core function is battery charge and discharge optimisation: rather than simply charging the battery when solar generation is high and discharging it when generation stops, the system is making dynamic decisions based on a layered set of inputs.
Weather forecast integration is the foundation. Most platforms now pull 24 to 72-hour solar irradiance forecasts and use them to model expected generation. If tomorrow is forecast to be a full sun day, the system may choose to partially discharge the battery tonight rather than hold it fully charged - because it knows the battery will be refilled by midday and holding reserve capacity overnight for a grid outage that doesn't come is a less optimal use of the asset than powering the household cheaply through the evening.
Time-of-use tariff optimisation layers on top of this. For households on time-varying electricity plans - which most South Australian retailers now offer - the platform knows exactly when grid electricity is expensive and when it's cheap. It charges the battery during cheap off-peak windows, holds charge through peak pricing periods, and dispatches stored energy precisely when drawing from the grid would cost the most. Done well, this alone can meaningfully reduce grid electricity costs beyond what simple solar self-consumption achieves.
Demand response participation adds a third layer. Households enrolled in virtual power plant programs - SA Power Networks' Retailer Reliability Obligation programs, AGL's VPP, or the Tesla Energy Plan - receive dispatch signals from the aggregator that the inverter software responds to automatically. The homeowner doesn't need to do anything. The system exports to the grid when it's needed and earns the household a payment or credit in return.
What the Data Reveals About How Australians Use Power
Aggregated across hundreds of thousands of connected systems, solar monitoring platforms have generated an unusually detailed picture of residential energy consumption patterns in Australia - one that is reshaping how energy retailers, network operators, and hardware manufacturers think about the home.
The patterns are consistent enough to be predictable. Consumption spikes at 7am when households wake, drops through the middle of the day when solar generation peaks, rises again at 5 to 7pm as families return home and the grid hits its daily stress peak, then tapers off through the evening. This duck curve - named for its profile shape - has been observed in every high-solar-penetration grid in the world, but SA's data is among the most extreme.
What's interesting is how battery systems are changing the shape of that curve at the household level. Homes with well-optimised storage systems show a dramatically flatter consumption profile from the grid's perspective. Solar charges the battery through the day, the battery covers the evening peak, and grid imports shrink to a narrow overnight window. Network operators can see this effect in aggregate load data, and it's one of the arguments driving continued government support for residential battery storage.
The monitoring platforms are also generating a maintenance dataset that the industry is only beginning to use systematically. Fleet-level performance data - comparing how a specific panel model is degrading across thousands of installations in similar climate conditions - is increasingly informing both warranty assessment and future product specifications. A panel that was sold with a 0.5% annual degradation guarantee but is showing 0.9% average degradation across 10,000 units in SA's summer heat conditions is a panel whose manufacturer has a warranty exposure problem. The data to identify that is now available in ways it simply wasn't a decade ago.
The Gap Between What's Possible and What Most Owners Experience
For all the sophistication of modern solar monitoring platforms, the average homeowner's experience remains fairly thin. Most people check generation totals occasionally, notice when something looks wrong, and call their installer if the app shows an error code. The deeper optimisation features - tariff scheduling, weather-responsive battery management, VPP enrolment - are either not configured, not understood, or both.
This is partly a setup problem. The default configuration on most inverter systems is conservative and generic - it's designed to work adequately for the broadest range of users rather than to be optimised for any specific household's tariff structure, consumption pattern, or grid connection. Getting from adequate to optimised typically requires either a technically confident owner willing to explore the platform's advanced settings, or a service visit from an installer who understands both the hardware and the local energy market.
It's also a literacy problem. Solar monitoring apps have outpaced the ability of most homeowners to interpret what they're showing. Generation graphs are intuitive. Reactive power compensation settings are not. The industry has work to do in translating the genuine intelligence these platforms contain into decisions and actions that non-technical users can actually act on.
The Platform as the Product
There's a broader shift underway in how the solar industry thinks about its product. For the first decade of the residential solar boom, the product was the hardware - the panels, the inverter, the racking system. Software was an afterthought, often developed by third parties and bolted on.
That's changing. The major inverter manufacturers - Sungrow, SMA, Fronius, SolarEdge - now invest heavily in their monitoring and optimisation platforms, and they're increasingly treating the software as a long-term relationship with the customer rather than a one-time installation. Over-the-air firmware updates push new optimisation algorithms to existing hardware. New tariff integrations are added as retailers launch new products. VPP partnerships get added to the platform without any physical change to the system.
The solar system on your roof is no longer just a piece of electrical infrastructure. It's a connected device, running software that's updated, monitored, and increasingly intelligent. For the 3.5 million Australian households that have made that investment, understanding what the app is actually doing - and making sure it's configured to do it well - is where the next round of returns are sitting.